Introduction
You have built an AI model. It is trained, validated, and ready for deployment. But how do you know if it is actually any good?
Measuring AI model performance is not as simple as looking at a single number. A model that is 95% accurate on a dataset might be completely useless for your business problem. Conversely, a model with lower overall accuracy might be perfectly suited to your needs.
Understanding how to measure performance—and which metrics matter for your specific problem—is essential for building AI that delivers real value. The wrong metric leads to the wrong model. The right metric ensures your model aligns with business goals.
This article explains the most important performance metrics for AI models: accuracy, precision, recall, F1 score, and others. It covers when to use each, how to interpret them, and common pitfalls to avoid. Whether you are a data scientist evaluating models, a business leader reviewing AI projects, or someone building foundational AI literacy, this guide will help you understand what “good” really means.
For a foundational understanding of how AI models are developed and validated, you may find our guide on the AI Lifecycle: From Data Collection to Deployment helpful as a starting point.
Throughout, we will highlight how MHTECHIN helps organizations define, measure, and optimize the metrics that matter for their AI systems.
Section 1: Why Measuring Performance Matters
1.1 Not All Metrics Are Created Equal
Imagine you are building a model to detect a rare disease that affects 1% of the population. You train a model that predicts “no disease” for every single patient. What is its accuracy?
Ninety-nine percent. The model is 99% accurate—yet it is completely useless. It never detects the disease. This example illustrates a critical point: accuracy alone is often misleading.
The right metric depends on your problem, your data, and the costs of different types of errors. A spam filter that occasionally marks a legitimate email as spam (false positive) is annoying but not catastrophic. A fraud detection system that misses a fraudulent transaction (false negative) can cost millions.
1.2 The Confusion Matrix: Foundation of Performance Metrics
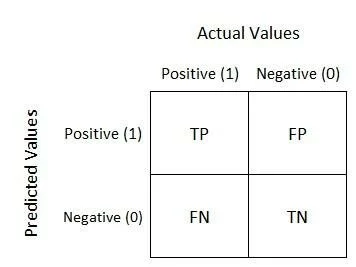
Most performance metrics are derived from the confusion matrix, which compares predictions to actual outcomes.
| Actual \ Predicted | Positive | Negative |
|---|---|---|
| Positive | True Positive (TP) | False Negative (FN) |
| Negative | False Positive (FP) | True Negative (TN) |
- True Positive (TP). Model correctly predicted the positive class.
- True Negative (TN). Model correctly predicted the negative class.
- False Positive (FP). Model predicted positive, but actual was negative. (Type I error)
- False Negative (FN). Model predicted negative, but actual was positive. (Type II error)
From these four numbers, we calculate all key performance metrics.
1.3 Business Costs of Different Errors
Different errors have different costs. Before choosing metrics, understand:
- Cost of a false positive. What happens when the model predicts something that is not true? (e.g., flagging a legitimate transaction as fraud—customer friction, manual review costs)
- Cost of a false negative. What happens when the model misses something it should have caught? (e.g., missing actual fraud—financial loss)
The ratio of these costs determines which metrics matter most.
Section 2: Core Performance Metrics
2.1 Accuracy
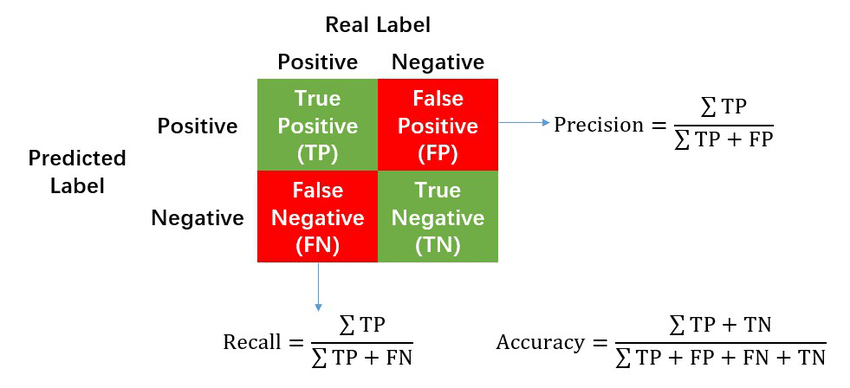
Definition. Accuracy is the proportion of correct predictions out of all predictions.
Accuracy = (TP + TN) / (TP + TN + FP + FN)
When to Use. Accuracy is useful when classes are balanced and the costs of false positives and false negatives are similar.
When to Avoid. Accuracy is misleading when classes are imbalanced. In the disease detection example with 1% prevalence, a model that predicts “no disease” for everyone is 99% accurate—but useless.
Example. A model correctly predicts 90 out of 100 cases. Accuracy = 90%.
2.2 Precision
Definition. Precision measures how many of the predicted positive cases were actually positive. It answers: when the model says “yes,” how often is it right?
Precision = TP / (TP + FP)
When to Use. Precision matters when false positives are costly. In spam detection, you want high precision—you do not want legitimate emails marked as spam. In fraud detection, high precision means fewer false alarms.
Example. A fraud model flags 100 transactions as fraudulent. Of these, 80 are actually fraud. Precision = 80%.
2.3 Recall (Sensitivity)
Definition. Recall measures how many of the actual positive cases the model caught. It answers: of all the “yes” cases that existed, how many did we catch?
Recall = TP / (TP + FN)
When to Use. Recall matters when false negatives are costly. In disease detection, you want high recall—you do not want to miss actual cases. In security, you want to catch as many threats as possible, even if you get some false alarms.
Example. There are 100 actual fraudulent transactions. The model catches 90 of them. Recall = 90%.
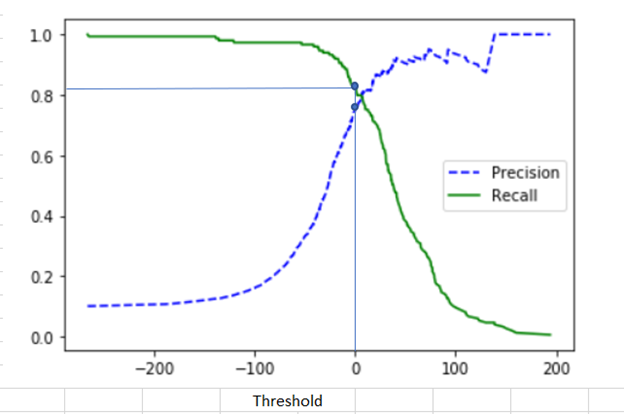
2.4 The Precision-Recall Trade-Off
Precision and recall are often in tension. Increasing one often decreases the other.
Imagine a fraud detection model. If you set a very low threshold for flagging fraud, you will catch almost all fraud (high recall) but also flag many legitimate transactions (low precision). If you set a very high threshold, you will only flag the most obvious fraud (high precision) but miss many actual fraud cases (low recall).
The right balance depends on business costs. In medical screening, you might prioritize recall (catch all potential cases, even with some false positives). In email spam filtering, you might prioritize precision (avoid false positives, even if some spam gets through).
2.5 F1 Score
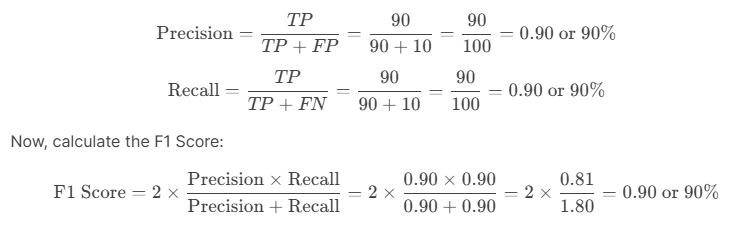
Definition. The F1 score is the harmonic mean of precision and recall. It provides a single number that balances both.
*F1 = 2 × (Precision × Recall) / (Precision + Recall)*
When to Use. F1 is useful when you need a single metric that balances precision and recall, and the costs of false positives and false negatives are roughly similar.
Example. Precision = 80%, Recall = 90%. F1 = 2 × (0.8 × 0.9) / (0.8 + 0.9) = 2 × 0.72 / 1.7 = 0.85 or 85%.
2.6 Specificity (True Negative Rate)
Definition. Specificity measures how many of the actual negative cases were correctly identified.
Specificity = TN / (TN + FP)
When to Use. Specificity matters when true negatives are important—when correctly identifying negative cases has value. In medical screening, high specificity means fewer healthy people are incorrectly told they might have a disease.
2.7 False Positive Rate
Definition. The proportion of actual negatives that were incorrectly predicted as positive.
*False Positive Rate = FP / (TN + FP) = 1 – Specificity*
When to Use. False positive rate is critical when false alarms are costly.
Section 3: Advanced Metrics
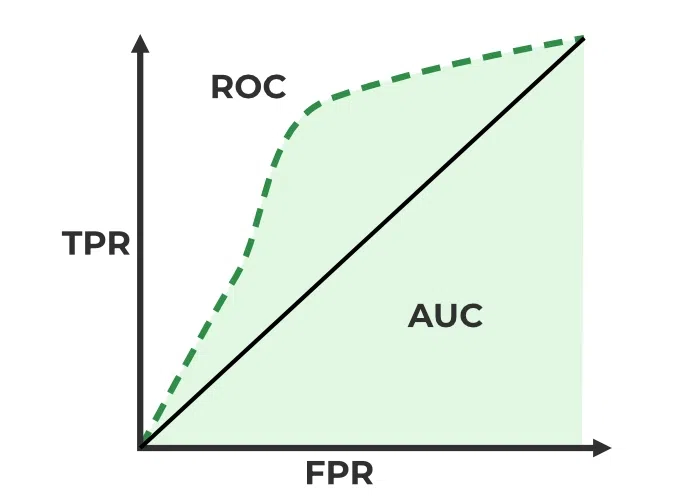
3.1 ROC Curve and AUC
The Receiver Operating Characteristic (ROC) curve plots the true positive rate (recall) against the false positive rate at different classification thresholds. It shows the trade-off between catching positives and avoiding false alarms.
AUC (Area Under the Curve) summarizes the ROC curve as a single number. AUC ranges from 0.5 (random guessing) to 1.0 (perfect classifier).
- AUC 0.5–0.7. Poor to fair
- AUC 0.7–0.8. Acceptable
- AUC 0.8–0.9. Excellent
- AUC 0.9–1.0. Outstanding
AUC is useful when you care about overall ranking ability and want a threshold-agnostic metric.
3.2 Precision-Recall Curve and Average Precision
When classes are imbalanced, the precision-recall curve is often more informative than ROC. The Average Precision (AP) summarizes the precision-recall curve.
For imbalanced problems—like fraud detection, disease screening—precision-recall curves provide a clearer picture of performance than ROC.
3.3 Log Loss (Cross-Entropy)
For probabilistic models (those that output probabilities, not just classes), log loss measures how well the predicted probabilities match the actual outcomes. Lower log loss is better.
Log loss penalizes confident wrong predictions heavily. If a model predicts 95% probability of fraud and is wrong, log loss is high.
3.4 Mean Absolute Error (MAE) and Root Mean Squared Error (RMSE)
For regression problems (predicting numerical values), different metrics apply:
- Mean Absolute Error (MAE). Average absolute difference between predictions and actuals. Easier to interpret.
- Root Mean Squared Error (RMSE). Square root of average squared error. Penalizes large errors more heavily than MAE.
Choosing between MAE and RMSE depends on whether you want to penalize outliers heavily (RMSE) or treat all errors linearly (MAE).
Section 4: Choosing the Right Metrics for Your Problem
4.1 Metrics by Problem Type
| Problem Type | Primary Metrics | Secondary Metrics |
|---|---|---|
| Binary Classification (Balanced) | Accuracy, F1 | Precision, Recall, AUC |
| Binary Classification (Imbalanced) | Precision, Recall, F1 | AUC-PR, Specificity |
| Multiclass Classification | Accuracy, Macro/Micro F1 | Per-class Precision, Recall |
| Regression | MAE, RMSE | R², MAPE |
| Ranking/Recommendation | Precision@k, Recall@k | NDCG, MAP |
| Probabilistic Output | Log Loss | Brier Score, Calibration |
4.2 Aligning Metrics with Business Goals
The most sophisticated metric is useless if it does not align with business objectives.
Example: Fraud Detection. If the cost of a missed fraud (false negative) is $10,000 and the cost of a false alarm (false positive) is $10, the business should prioritize recall over precision. A model with 99% recall and 50% precision may be better than one with 95% recall and 95% precision.
Example: Email Spam Filter. If a false positive (legitimate email marked as spam) causes significant user frustration, precision matters more than recall.
Example: Medical Screening. If missing a disease (false negative) could be life-threatening, recall is critical—even if it means more false positives that require follow-up testing.
4.3 Metrics for Different Stakeholders
Different stakeholders care about different metrics:
- Business leaders. Business metrics: cost savings, revenue impact, operational efficiency
- Data scientists. Technical metrics: precision, recall, AUC, MAE
- Compliance/risk. Fairness metrics, false positive/negative rates by demographic group
Effective communication requires translating technical metrics into business impact.
Section 5: Common Pitfalls and How to Avoid Them
5.1 Overfitting to the Test Set
The Pitfall. Tuning models based on test set performance, leading to optimistic estimates that do not hold in production.
Prevention. Keep the test set completely separate. Use only the validation set for tuning. Test once at the end.
5.2 Ignoring Class Imbalance
The Pitfall. Using accuracy on imbalanced data, leading to misleading conclusions.
Prevention. Always examine precision, recall, and confusion matrix. Use stratified sampling to maintain class balance in train/test splits.
5.3 Optimizing the Wrong Metric
The Pitfall. Optimizing for accuracy when precision or recall matters more.
Prevention. Start with business objectives. Define success metrics before building models. Choose the metric that aligns with business costs.
5.4 Not Considering Business Costs
The Pitfall. Treating all errors equally when they have very different costs.
Prevention. Assign costs to different error types. Use cost-sensitive learning or adjust decision thresholds based on cost ratios.
5.5 Overlooking Model Calibration
The Pitfall. Focusing only on classification metrics while ignoring whether predicted probabilities are well-calibrated.
Prevention. For probabilistic predictions, examine calibration curves. Use log loss or Brier score alongside classification metrics.
Section 6: How MHTECHIN Helps with Performance Measurement
Measuring AI performance correctly requires expertise in metrics, business alignment, and validation methodologies. MHTECHIN helps organizations define, measure, and optimize the metrics that matter.
6.1 For Metric Definition
MHTECHIN helps organizations:
- Align metrics with business goals. What are you trying to achieve? What costs matter?
- Choose appropriate metrics. Classification, regression, ranking—which metrics fit your problem?
- Set targets. What performance is “good enough” for deployment?
6.2 For Validation and Testing
MHTECHIN designs rigorous validation frameworks:
- Data splitting. Train, validation, test—ensuring representative splits.
- Cross-validation. Robust performance estimation.
- Fairness testing. Evaluating performance across demographic groups.
- Edge case testing. Ensuring models handle real-world complexity.
6.3 For Model Selection
MHTECHIN helps compare models:
- Metric-based selection. Which model performs best on the metrics that matter?
- Trade-off analysis. Understanding precision-recall trade-offs.
- Interpretability. Balancing performance with explainability needs.
6.4 For Monitoring in Production
MHTECHIN implements ongoing performance monitoring:
- Dashboarding. Real-time visibility into metrics.
- Alerting. Notifications when performance degrades.
- Drift detection. Identifying when models need retraining.
6.5 The MHTECHIN Approach
MHTECHIN’s performance measurement practice combines technical rigor with business understanding. The team knows that the right metric is not always the most sophisticated—it is the one that aligns with what you are trying to achieve.
Section 7: Frequently Asked Questions
7.1 Q: What is the difference between accuracy and precision?
A: Accuracy measures overall correctness—how many predictions were right. Precision measures how many predicted positives were actually positive. A model can have high accuracy but low precision if the class imbalance is severe.
7.2 Q: When should I use precision vs recall?
A: Use precision when false positives are costly (e.g., spam filters—legitimate emails flagged as spam). Use recall when false negatives are costly (e.g., disease detection—missing actual cases). The choice depends on business costs.
7.3 Q: What is a good F1 score?
A: It depends on the problem. In some domains, F1 above 0.8 is excellent; in others, 0.6 may be acceptable. The baseline is important: if a trivial model achieves 0.5, a good model might be 0.7–0.8.
7.4 Q: Why is accuracy misleading for imbalanced data?
A: With imbalanced data, a model that predicts only the majority class can achieve high accuracy while being useless. For example, with 99% negative cases, predicting “negative” for everything yields 99% accuracy but fails to detect any positive cases.
7.5 Q: What is the difference between ROC AUC and precision-recall AUC?
A: ROC AUC is threshold-agnostic and works well for balanced data. Precision-recall AUC is more informative for imbalanced data because it focuses on the minority class. For fraud detection, disease screening, and other imbalanced problems, precision-recall AUC is often preferred.
7.6 Q: How do I choose between MAE and RMSE for regression?
A: MAE treats all errors linearly; RMSE penalizes large errors more heavily. If outliers are important to capture, use RMSE. If you want a more interpretable metric in the same units as the target, use MAE.
7.7 Q: What is overfitting and how do I detect it?
A: Overfitting occurs when a model performs well on training data but poorly on test data. It means the model has memorized training examples rather than learning generalizable patterns. Detect it by comparing training and test performance—if they diverge significantly, overfitting is likely.
7.8 Q: How do I handle multiple metrics that conflict?
A: When metrics conflict, prioritize based on business costs. If false negatives cost $1,000 and false positives cost $10, prioritize recall. Document trade-offs and set thresholds accordingly.
7.9 Q: What is model calibration?
A: Calibration measures whether predicted probabilities match actual probabilities. A well-calibrated model that predicts 80% probability should be correct about 80% of the time. Calibration matters when decisions depend on probability thresholds.
7.10 Q: How does MHTECHIN help with performance measurement?
A: MHTECHIN helps organizations define metrics aligned with business goals, design rigorous validation frameworks, compare models, and monitor performance in production. We ensure you measure what matters.
Section 8: Conclusion—Measure What Matters
Measuring AI model performance is not about finding a single “best” metric. It is about understanding your problem, your data, and your business context, and choosing metrics that reflect what success actually means.
Accuracy is intuitive but often misleading. Precision and recall capture different types of errors. The F1 score balances them. AUC provides a threshold-agnostic view. For regression, MAE and RMSE measure prediction error.
But the most sophisticated metric is useless if it does not align with business goals. A fraud detection model optimized for precision may prevent false alarms but miss costly fraud. A disease screening model optimized for recall may catch more cases but cause unnecessary anxiety and follow-up testing. The right metric balances costs and benefits.
For organizations serious about AI, performance measurement is not an afterthought. It is a discipline—one that requires technical rigor, business understanding, and continuous attention. With the right metrics, you can build models that deliver real value.
Ready to measure what matters? Explore MHTECHIN’s AI validation and performance optimization services at www.mhtechin.com. From metric definition through production monitoring, our team helps you build models that perform.
This guide is brought to you by MHTECHIN—helping organizations measure and optimize AI model performance for real-world impact. For personalized guidance on AI validation or performance strategy, reach out to the MHTECHIN team today.
Leave a Reply