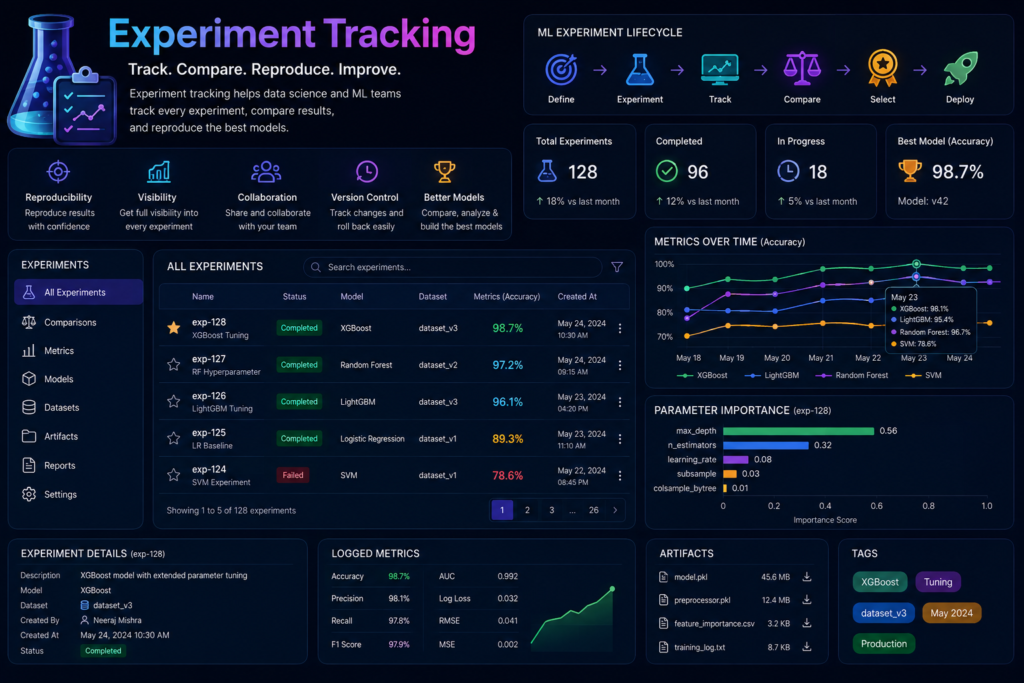
Experiment Tracking: The Complete Enterprise Guide to Managing, Monitoring, and Reproducing AI & Machine Learning Experiments
The Notebook Graveyard at 3 AM
It’s 3 AM. A data scientist is scrolling through a folder of 47 Jupyter notebooks with names like final_model_v2_final.ipynb, experiment_29_real_final.ipynb, and model_training_optimized_FINAL.ipynb. The team needs to reproduce the model that achieved an 87% F1 score three weeks ago. Nobody can remember which notebook, dataset version, or hyperparameter configuration produced it.
This scene plays out daily in organizations around the world. The journey from idea to production model involves thousands of decisions: model architectures, hyperparameters, data versions, preprocessing steps. Each combination produces different results, and without a systematic way to track them, teams waste weeks recreating what they’ve already done—and sometimes never find the “best” model at all .
Experiment tracking transforms ML development from ad-hoc trial and error into structured, reproducible science. It captures every detail of every training run: the hyperparameters, the metrics, the code, the environment, and crucially, the lineage to the dataset and model version that produced it . The difference between teams that ship reliable AI products and teams that constantly struggle? Systematic experiment tracking. Let’s explore how to implement it at enterprise scale .
What Is Experiment Tracking?
Experiment tracking is the systematic practice of capturing, organizing, and managing all information from machine learning training runs . It acts as the bridge between analyzing results and testing new ideas. Every experiment run is recorded with its hyperparameters, evaluation metrics, code, environment configuration, data version references, and any artifacts generated during the process .
Think of it as GitHub commits for AI experiments—but with capabilities specific to ML workflows: automatic metric visualization, hyperparameter comparison, artifact storage, and model registry integration.
Experiment Tracking vs. Experiment Management
While often used interchangeably, there’s a subtle distinction. Experiment tracking focuses on the core act of logging and organizing experimental data. Experiment management encompasses the broader workflow: planning experiments, orchestrating distributed training runs, managing model serving, monitoring production quality, and orchestrating retraining pipelines . Experiment tracking is a foundational component of the larger MLOps ecosystem .
The Problem It Solves
Without experiment tracking, teams face a death by a thousand cuts:
- “I know I ran this model somewhere, but I can’t find the notebook”
- “I think I had a better learning rate last week, but I overwrote it”
- “What data version was that experiment trained on?”
- “How do I replicate what Bob did on his laptop?”
With experiment tracking, every run is searchable, comparable, and reproducible—and every run has an answer to “what changed?” .
Why Experiment Tracking Is Critical for Enterprise AI
1. Reproducibility
The core value of experiment tracking is reproducibility . A model that performs well in a notebook but cannot be recreated is not a model—it is a lucky accident. Structured logging gives you the full recipe: learning rate, batch size, data split, random seed, and every evaluation metric across every epoch . This is essential in regulated industries where you must be able to reproduce model performance on demand.
2. Faster Model Development
Experimentation tracking accelerates iteration. Instead of manually recording what you tried, you can query your experiment database: “Show me all runs with learning rate 0.001 where the architecture was ResNet50, sorted by validation accuracy.” Tools like MLflow support this natively, allowing teams to compare runs and identify winning configurations in minutes, not days .
3. Collaboration and Knowledge Sharing
When multiple data scientists work on the same project, experiment tracking provides a single source of truth . A teammate who picks up your experiment gets the full picture—the code, parameters, metrics, and data lineage—without a 30-minute Slack thread . This consistency eliminates the chaos that plagues shared ML projects.
4. Audibility and Compliance
With increasing AI regulations (particularly the EU AI Act), organizations require detailed audit trails of model training data, performance expectations, and development processes . Experiment tracking provides this evidence: every run records the dataset version, model version, hyperparameters, evaluation metrics, code commit, and environment. This satisfies regulatory requirements, SOC 2, and HIPAA compliance needs .
5. Efficient Hyperparameter Optimization
Experiment tracking is the foundation of systematic hyperparameter optimization. By logging every parameter and its corresponding performance, you can use tools like Optuna to automatically search the hyperparameter space, with every trial automatically recorded and compared .
6. Bridging Training and Production
Tracking the same evaluation metrics during training and production creates a feedback loop . When production performance degrades, you can trace it back to specific training runs and determine whether the cause is data drift, a hyperparameter issue, or a system resource constraint .
7. The Business Case
Research shows up to 85% of AI projects fail to deliver expected business value—often because teams lack operational discipline around tracking what they ship . Experiment tracking is not just a best practice; it is a business necessity .
How Experiment Tracking Works: The Production-Grade Setup
The Core Workflow
The complete experiment lifecycle follows the data’s journey through the ML pipeline:
text
┌─────────────────────┐
│  PROBLEM DEFINITION │ - Business requirement or research question
└──────────┬──────────┘
           ▼
┌─────────────────────┐
│  DATASET SELECTION  │ - Identify and version training, validation, test data
└──────────┬──────────┘
           ▼
┌─────────────────────┐
│ FEATURE ENGINEERING │ - Transform raw data into model features
└──────────┬──────────┘
           ▼
┌─────────────────────┐
│  MODEL TRAINING     │ - Run training with specific hyperparameters
└──────────┬──────────┘
           ▼
┌─────────────────────┐
│ PARAMETER LOGGING   │ - Record every hyperparameter
└──────────┬──────────┘
           ▼
┌─────────────────────┐
│  METRIC RECORDING   │ - Capture train, validation, test metrics
└──────────┬──────────┘
           ▼
┌─────────────────────┐
│  ARTIFACT STORAGE   │ - Save model weights, plots, configs
└──────────┬──────────┘
           ▼
┌─────────────────────┐
│ EXPERIMENT COMPARE  │ - Compare across runs visually
└──────────┬──────────┘
           ▼
┌─────────────────────┐
│  MODEL SELECTION    │ - Choose best model version
└──────────┬──────────┘
           ▼
┌─────────────────────┐
│     DEPLOYMENT      │ - Register in model registry
└──────────┬──────────┘
           ▼
┌─────────────────────┐
│  CONTINUOUS IMPROVE │ - Monitor, learn, and iterate
└─────────────────────┘
Naming Conventions That Scale
Consistent naming is the foundation of experiment organization . Teams should adopt a structured naming pattern:
Experiment naming: {project}/{model_family}/{objective}
fraud-detection/lightgbm/pr-auc-optimizationrecommender/two-tower/recall-at-10demand-forecast/temporal-fusion/mape-reduction
Run naming: {date}_{description}_{variant}
2026-01-15_baseline_v12026-01-15_smote-oversampling_v22026-01-16_tuned-hyperparams_v3
Model naming (registry): {project}-{model_type}-{version_strategy}
fraud-lgbm-v3recommender-two-tower-v1demand-tft-v2
Rules: Use lowercase, hyphens for spaces, date prefix for chronological sorting, version suffix for lineage tracking, and never use special characters or spaces .
Core Components of Experiment Tracking
Every experiment record should include :
🟢 Experiment ID: Unique identifier for the run
🟢 Hyperparameters: All training parameters (learning rate, batch size, optimizer, model architecture details, regularization settings)
🟢 Evaluation Metrics: Train loss, validation loss, accuracy, F1, AUC-ROC, RMSE, PR-AUC, inference latency
🟢 System Metrics: GPU memory usage per epoch, CPU load, RAM consumption, disk I/O
🟢 Artifacts: Model weights, serialized model, confusion matrix, SHAP summary, feature importance, ROC curve, PR curve, configuration files
🟢 Data Version: Dataset version ID, data sources, train/validation split metadata
🟢 Environment: Framework version, CUDA version, Python version, installed dependencies
🟢 Code Version: Git commit hash, Git branch, code repository URL
🟢 Author: Who ran the experiment
🟢 Timestamp: When the experiment ran
🟢 Tags: Labels for filtering (team, stage, data version, git commit)
🟢 Status: Completed, failed, or in-progress
Pro Tip: Tag every run with metadata like dataset version, git commit hash, and team member name. These tags cost nothing to log and save hours when you need to audit which run used which data version .
The Experiment Lifecycle: From Idea to Production
The enterprise experiment lifecycle follows seven stages :
Stage 1: Problem Identification
Define the business problem or research question. What metric are you optimizing? What constraints apply (latency, cost, interpretability)?
Stage 2: Dataset Collection and Versioning
Identify training, validation, and test datasets. Version them immutably and log the references. Crucial: You must track what data went into each model to support reproducibility and lineage .
Stage 3: Preprocessing and Feature Engineering
Transform raw data into model inputs. Log the feature engineering code version and any significant changes. Link the dataset version to the transformed features.
Stage 4: Model Training with Experiment Logging
Each training run captures hyperparameters, metrics, and system data. Key best practices:
- All hyperparameters (learning rate, batch size, optimizer, regularization settings, model architecture details)
- Both train and validation metrics (detect overfitting)
- Wall clock time (not just epochs)
- Data statistics (detects silent data issues)
- Git commit hash and random seed (reproducibility)
- GPU memory, utilization, and training speed
python
import mlflow
from mlflow.tracking import MlflowClient

# Configuration
mlflow.set_tracking_uri("http://mlflow-server:5000")
mlflow.set_experiment("fraud-detection/lightgbm/pr-auc-optimization")

# Structured run
with mlflow.start_run(run_name="2026-01-15_baseline_v1") as run:
    # 1. Log parameters (ALL of them)
    mlflow.log_params({
        'model_type': 'lightgbm',
        'n_estimators': 500,
        'learning_rate': 0.05,
        'max_depth': 7,
        'num_leaves': 63,
        'class_weight': 'balanced',
        'train_rows': len(X_train),
        'feature_count': X_train.shape[1],
        'train_date_range': f"{train_start} to {train_end}",
        'cv_folds': 5,
    })

    # 2. Log metrics (train + validation + test)
    mlflow.log_metrics({
        'train_pr_auc': train_score,
        'val_pr_auc': val_score,
        'test_pr_auc': test_score,
        'val_f1': f1_score,
        'val_mcc': mcc_score,
        'training_time_seconds': elapsed,
    })

    # 3. Log artifacts
    mlflow.log_artifact("confusion_matrix.png")
    mlflow.log_artifact("shap_summary.png")
    mlflow.log_artifact("feature_importance.csv")

    # 4. Log model with signature
    from mlflow.models import infer_signature
    signature = infer_signature(X_test, model.predict(X_test))
    mlflow.sklearn.log_model(model, "model", signature=signature)

    # 5. Log dataset info
    mlflow.log_input(
        mlflow.data.from_pandas(X_train, name="training_data"),
        context="training"
    )

    # 6. Tags for filtering
    mlflow.set_tags({
        'team': 'ml-platform',
        'stage': 'experimentation',
        'data_version': 'v2.3',
        'git_commit': git_sha,
    })
Stage 5: Experiment Comparison and Analysis
Use the experiment tracking dashboard to compare runs side-by-side. Sort by validation metric, filter by hyperparameter ranges, and identify the most promising configurations.
Stage 6: Model Selection and Registration
Register the best model version in a model registry, linking it to the exact experiment run. This provides full lineage: dataset version → code → hyperparameters → metrics → model version.
MLflow Model Registry integration :
python
from mlflow.tracking import MlflowClient

client = MlflowClient()

# Register model from experiment run
model_uri = f"runs:/{run_id}/model"
mv = client.create_model_version(
    name="fraud-detection-lgbm",
    source=model_uri,
    run_id=run_id,
    description="LightGBM with balanced weights, PR-AUC=0.87"
)

# Stage transitions: None → Staging → Production → Archived
client.transition_model_version_stage(
    name="fraud-detection-lgbm",
    version=mv.version,
    stage="Staging",
    archive_existing_versions=False,
)

# Promote to production after validation
client.transition_model_version_stage(
    name="fraud-detection-lgbm",
    version=mv.version,
    stage="Production",
    archive_existing_versions=True,  # archive previous production version
)
Stage 7: Production Monitoring and Continuous Improvement
Link production monitoring metrics back to experiment tracking. When production performance degrades, trace it back to the specific training run and identify the cause . Tag experiments with the deployment status for complete auditability .
Enterprise Use Cases
🏦 Banking: Fraud Detection
Fraud detection teams need reproducibility and auditability . Each experiment logs dataset versions, hyperparameters, and evaluation metrics. When regulatory questions arise, the team can show exactly what data and configuration produced each model . “A modest modification in training information can have a significant influence on performance. Without tracking exactly what you did, you can’t compare or recreate the outcomes” .
🏥 Healthcare: Clinical Decision Support
Healthcare applications require HIPAA compliance and explainability. Experiment tracking provides complete lineage from data to model, documenting preprocessing steps, data sources, and evaluation thresholds for every model version. This supports clinical validation and regulatory approval.
🛒 E-Commerce: Recommendation Systems
Product recommendation models iterate weekly based on seasonality, inventory, and customer behavior. Experiment tracking enables teams to compare different model architectures, feature sets, and hyperparameter combinations side-by-side, quickly identifying the most effective configuration.
🚗 Automotive: Autonomous Vehicle Perception
Self-driving car models require massive experiments across sensor configurations, weather conditions, and geographic regions. Experiment tracking captures the full context: dataset version, preprocessing pipeline, model architecture, training duration, and evaluation metrics across a comprehensive test suite.
🏭 Manufacturing: Predictive Maintenance
Factory sensor data drifts as equipment ages. Experiment tracking documents model performance over time, enabling teams to detect when models degrade and trigger retraining with newer data.
Experiment Tracking vs. Model Versioning vs. Data Versioning
| Aspect | Experiment Tracking | Model Versioning | Data Versioning |
|---|---|---|---|
| What is tracked | The entire training run: parameters, metrics, code, environment, and lineage | Model weights, architecture, and metadata | Dataset versions and labels |
| Primary purpose | Reproduce and compare experiments | Manage model lifecycle and deployments | Track data changes and lineage |
| Frequency of change | Continuous (every training run) | Weekly to monthly | Daily to weekly |
| Who uses it | Data scientists, ML engineers | ML engineers, MLOps | Data engineers, data scientists |
| Key capabilities | Hyperparameter comparison, metric visualization, artifact storage | Stage transitions, rollback, production tracking | Time-travel queries, data diffs |
| Outcome | Identify the best model configuration | Manage deployed models | Ensure data reproducibility |
Popular Experiment Tracking Tools
🔹 MLflow
Best for: Teams needing an open-source solution with strong model registry integration
Key capabilities: Open-source tracking server, excellent model registry, autologging for PyTorch, TensorFlow, scikit-learn, XGBoost, and integration with Databricks . MLflow 3.0 introduces LoggedModel entities, comprehensive performance tracking, human-in-the-loop feedback, and prompt optimization for GenAI workflows .
Pros: Open source, excellent model registry, Databricks native
Cons: Basic visualization compared to commercial alternatives
Cost: Free (open source), self-hosted or cloud-based
🔹 Weights & Biases (W&B)
Best for: Teams needing deep visualization and collaboration features
Key capabilities: Excellent visualization, built-in hyperparameter sweeps, reports for collaboration, GPU monitoring, media logging
Cost: Free tier, enterprise starts ~$50+/user/month
🔹 Comet ML
Best for: Enterprise teams needing comprehensive experiment management
Key capabilities: Automatic dataset versioning and lineage tracking, hyperparameter optimization, model monitoring, available as an AWS Partner AI App with SageMaker integration , supports open-source Opik for LLM observability
Cost: Free tier, enterprise starts ~$49+/user/month
🔹 Neptune.ai
Best for: Teams wanting a managed solution with flexible pricing
Key capabilities: Good visualization, collaboration features, integration with Optuna
Cost: Free tier, enterprise starts ~$49+/user/month
🔹 ClearML
Best for: Teams wanting end-to-end MLOps with experiment tracking as a component
🔹 TensorBoard
Best for: Teams primarily using TensorFlow, basic visualization
🔹 Aim
Best for: Open-source alternative with focus on UX and large-scale datasets
25+ Best Practices for Enterprise Experiment Tracking
Naming and Organization
- Use descriptive experiment and run names
[project]/[model-family]/[objective]and[date]_[description]_[variant] - Log comprehensive metadata—don’t assume context will be remembered
- Tag every run with git commit, dataset version, team, and stage
- Create a consistent tagging system across the organization
- Use tags for advanced filtering—they cost nothing to log and save hours
Parameter and Metric Logging
- Log ALL hyperparameters—every parameter that could affect the model
- Log BOTH train and validation metrics—detect overfitting immediately
- Log evaluation metrics relevant to your business problem—F1, PR-AUC for imbalanced data, not just accuracy
- Log wall clock time and GPU utilization—detect resource bottlenecks
- Log system metrics—GPU memory, CPU load, disk I/O
- Log data statistics—row count, feature count, class distribution, date range
- Log the random seed—for complete reproducibility
- Log raw predictions alongside ground truth for a sample of the validation set—enables custom metrics post hoc
Efficiency and Performance
- Balance granularity and overhead—log every Nth step or per epoch, not every batch for long runs . MLflow enforces a limit of 10M metric steps per run, and each step adds ~2ms latency .
- Use autologging as baseline and layer custom logging on top . MLflow’s
autologcaptures parameters, losses, and artifacts for supported frameworks . - Store artifacts efficiently—only store what you need; define retention policies
text
ARTIFACT_RETENTION = {
    'production_models': 'forever',
    'staging_candidates': '180_days',
    'experiment_models': '30_days',
    'evaluation_plots': '90_days',
    'failed_runs': '7_days',
}
Version Control Integration
- Link experiments to code version—log git commit hash, branch, and remote URL
- Track code and environment together—any version of your project should be fully reproducible
- Use MLflow’s
log_inputto capture dataset version
Security and Compliance
- Implement access controls with role-based permissions (RBAC)
- Use encryption for experiment data at rest and in transit—critical for regulated data
- Enable audit logging for compliance (SOC 2, HIPAA, EU AI Act)
- For regulated environments, consider immutable storage—MLflow records are mutable; for tamper-evident audit trails, push artifacts to OCI-compliant registries with content-addressed digests
Continuous Improvement
- Connect experiment metrics to production monitoring—track the same metrics in both environments
- Use logged metrics to trigger retraining—when production performance degrades, it’s clear which experiment produced the failing model
Common Mistakes to Avoid
❌ Forgetting to log hyperparameters
Every hyperparameter that could affect performance must be logged . “When you skip logging, every failed experiment becomes a dead end. You cannot trace what changed, what caused a performance drop, or which configuration produced your best validation F1 score last Tuesday” .
❌ Missing dataset version references
This is the single biggest source of irreproducibility. Always log the dataset version, source, and any preprocessing steps .
❌ Poor experiment naming
Generic names (experiment_29, final, final_v2) make experiments unsearchable . Use the pattern [project]/[model-family]/[objective].
❌ Ignoring system metrics
A model with great metrics but 98% GPU memory usage is a production risk. System metrics catch this early .
❌ Overwriting experiments
Each experiment must be immutable. MLflow’s runs are append-only—use this to your advantage.
❌ Logging only final metrics
Metric curves are essential for detecting overfitting, learning rate issues, and data leakage. Log per-step or per-epoch data .
❌ No connection between experiments and model versions
The model registry must link back to the experiment run. Otherwise, you lose the training history .
❌ Manual tracking in spreadsheets
Spreadsheets scale poorly and are impossible to query programmatically. Use tools designed for the job .
❌ Not logging git commit
Without the git commit, you cannot reproduce the code that produced the run .
❌ Comparing experiments fairly
Always ensure you’re comparing runs with the same dataset version. Changing the dataset invalidates the comparison .
Security and Compliance Considerations
🔒 Role-Based Access Control (RBAC)
Implement granular permissions for who can view, edit, and deploy experiment data. Comet’s federated model with centrally managed infrastructure and autonomous team environments ensures both security and independence .
🔒 Encryption
Experiment data and artifacts must be encrypted at rest and in transit. This includes the tracking server database, artifact storage (S3, GCS, Azure), and API traffic.
🔒 Audit Logs
Every experiment and promotion must be logged. For regulated environments, consider immutable storage (OCI) in addition to mutable databases .
🔒 Regulatory Compliance (EU AI Act, HIPAA, SOC 2)
Experiment tracking provides the detailed audit trails required by regulations. Comet on SageMaker enables “enterprise-grade security, seamless workflow integration, and a straightforward procurement process through AWS Marketplace” . “With increasing AI regulations, particularly in the EU, organizations now require detailed audit trails of model training data, performance expectations, and development processes” .
🔒 Immutable Artifacts for Compliance
MLflow alone does not solve immutability. For regulated workloads, EvalHub’s OCI persistence layer pushes evaluation results to content-addressable registries with SHA256 digests. If the contents change, the digest changes—providing tamper evidence .
🔒 API Security
Use tokens or OAuth for programmatic access. Databricks supports both PATs and OAuth service principals .
The Enterprise Experiment Tracking Workflow in Production
The complete production workflow integrates experiment tracking with the full MLOps lifecycle :
Step 1: Problem Definition
Business requirement or research question defined. Success metrics established.
Step 2: Dataset Collection and Versioning
Data identified, versioned, and stored immutably. Dataset version ID logged in the experiment.
Step 3: Feature Engineering
Features extracted and transformed. Code version and transformation parameters logged.
Step 4: Training Pipeline Execution
Training run triggered (manually or via CI/CD). MLflow or equivalent logs hyperparameters, metrics, and system data.
Step 5: Experiment Logging
Complete record captured: parameters, metrics, artifacts, code version, environment, data version, tags, and status .
Step 6: Hyperparameter Tuning
Multiple runs with different hyperparameters. Experiment tracking enables side-by-side comparison .
Step 7: Evaluation and Comparison
Dashboard view of all experiments. Sort by key metrics, filter by parameters, identify promising runs .
Step 8: Best Model Selection
Winning model registered in model registry. Full lineage: experiment run → dataset version → model version.
Step 9: Production Deployment
Model promoted to staging, then production. Deployment record includes experiment ID, dataset version, and evaluation metrics.
Step 10: Production Monitoring
Same metrics logged in production as in training. Alerts on performance degradation .
Step 11: Continuous Retraining
When drift detected, trigger retraining with updated data. The new experiment links back to previous iterations.
Real-World Case Studies
Google: Foundation Model Training
Google’s experiment tracking for Gemini-scale training captures full provenance of every pre-training, fine-tuning, and evaluation run. This supports regulatory compliance and enables comparison across vast experiment spaces.
Netflix: Recommendation Systems
Netflix tracks experiments across hundreds of model variants. Experiment tracking enables A/B testing and rapid identification of winning configurations.
Uber: Michelangelo Platform
Uber’s ML platform features a standardized approach to experiment tracking, feature stores, and model lineage. This avoids repeatedly extracting feature sets where similar features may have different definitions .
OpenAI: LLM Experimentation
OpenAI uses experiment tracking to manage thousands of runs across model architectures, training data versions, and hyperparameter configurations. This enables rigorous comparison and supports reproducibility .
Amazon: SageMaker and Comet Integration
AWS demonstrates enterprise-scale experiment tracking with Comet as a Partner AI App on SageMaker. Teams get automated dataset versioning, lineage tracking, and full reproducibility for regulatory compliance .
Tesla: Autonomous Vehicle Models
Tesla’s experiment tracking captures dataset versions, sensor configurations, model architectures, and evaluation across diverse driving scenarios. This ensures safety-critical reproducibility.
SEO FAQ Section
1. What is experiment tracking?
Experiment tracking is the systematic practice of capturing, organizing, and managing all information from ML training runs—hyperparameters, metrics, artifacts, code version, environment, dataset version, and more .
2. Why is experiment tracking important?
It enables reproducibility, accelerates development, supports collaboration, provides audit trails for compliance, and ensures you can compare and debug models .
3. What should you log in an experiment?
Log all hyperparameters, both train and validation metrics, system metrics (GPU/CPU), dataset version, git commit hash, random seed, and artifacts (model weights, plots, configs) .
4. What is the difference between experiment tracking and model versioning?
Experiment tracking captures the full training run: parameters, metrics, code, environment, and lineage. Model versioning manages the lifecycle of trained models: versions, stage transitions, and deployments .
5. What are popular experiment tracking tools?
MLflow (open source), Weights & Biases, Comet ML, Neptune.ai, ClearML, and TensorBoard .
6. How does MLflow work?
MLflow provides a tracking server to log experiments, a model registry for versioning, and APIs for logging parameters, metrics, and artifacts. It supports autologging for many frameworks .
7. What is MLflow 3.0?
MLflow 3 is a major release with new LoggedModel entities, comprehensive lineage, prompt optimization, and human-in-the-loop feedback for GenAI workflows .
8. What is experiment tracking used for?
It’s used to compare runs, identify winning hyperparameters, reproduce results, debug failures, and provide audit trails .
9. How does experiment tracking support compliance?
It provides complete audit trails—every run records the dataset version, model version, hyperparameters, metrics, code commit, and environment. This satisfies EU AI Act, HIPAA, and SOC 2 requirements .
10. What metrics should be logged?
Performance metrics (accuracy, F1, AUC-ROC, RMSE), loss metrics (train/val loss), system metrics (GPU memory, CPU load, latency), and fairness metrics .
11. How often should you log metrics?
Balance granularity and overhead. For long runs, log per epoch; for debug runs, log per step. MLflow enforces 10M steps per run .
12. What is MLflow autologging?
MLflow’s autolog feature automatically captures parameters, losses, and model artifacts for supported frameworks (PyTorch, TensorFlow, scikit-learn, XGBoost) with minimal setup .
13. How do you compare ML experiments?
Use experiment tracking dashboards (MLflow UI, W&B, Comet) to sort, filter, and visualize runs. Query by metrics, parameters, or tags .
14. What is a model registry?
A model registry manages model lifecycle: registration, versioning, stage transitions (staging → production → archived), and deployment metadata .
15. What is the difference between MLflow and Weights & Biases?
MLflow is open source with an excellent model registry; W&B offers superior visualization and collaboration features but is commercial .
16. How do you track experiments in production?
Deploy the same tracking infrastructure, log production predictions, compare them to training metrics, and alert on drift .
17. What are experiment tags?
Tags are key-value pairs for filtering and grouping runs—team, dataset version, git commit, stage, status .
18. How do you handle failed experiments?
Log status and error information. Failed runs can still provide valuable insights .
19. What is the relationship between experiment tracking and MLOps?
Experiment tracking is a foundational component of MLOps, linking the research phase of model creation with deployment and monitoring .
20. Why do 85% of AI projects fail?
Industry research shows that AI projects often fail due to lack of operational discipline—weak tracking and missing governance . Experiment tracking provides the foundation for operational success.
Future Trends
🤖 AI Agents
Autonomous research systems like Chakra implement cyclic ML workflows where experiment tracking becomes the central nervous system for the entire operation—plan, execute, guard, review, and improve in a continuous loop .
🧠 Foundation Models
Experiment tracking for large-scale foundation models requires capturing lineage across datasets, training runs, and evaluation results. MLflow 3’s new architecture supports this .
⚡ Automated Experiment Tracking
AI-driven experiment management platforms automate the tracking, comparison, and selection process. Chakra’s Manthan stage proposes bounded ablation suggestions for the next iteration .
📊 AI Observability
The integration between training experiment tracking and production monitoring is deepening. MLflow 3 now “connects training observability to production monitoring, so the metrics you log during training become the baseline you monitor in deployment” .
🔗 LLMOps
Prompt engineering and agent tracking become first-class citizens. MLflow 3 includes prompt optimization, prompt versioning, and agent evaluation workflows .
🛡 AI Governance
Governance platforms connect experiment tracking to end-to-end lineage. Comet on SageMaker enables “enterprise-grade security, seamless workflow integration, and a straightforward procurement process through AWS Marketplace” .
📦 MLOps Platforms
Platforms are converging—experiment tracking, model registry, and deployment as an integrated product. MLflow 3 offers “comprehensive performance tracking and observability” across the entire AI lifecycle .
☁ Cloud-Native AI
AWS SageMaker, Google Vertex AI, Azure ML, and Databricks all offer integrated experiment tracking. Databricks provides a fully managed MLflow tracking server with native workspace integration .
📈 AutoML
Automated experiment tracking powers AutoML systems that generate and compare thousands of runs automatically.
🚀 Autonomous AI Systems
Self-improving AI systems need robust experiment tracking to audit and understand changes made by the system itself.
Conclusion: The Foundation of Enterprise AI
Experiment tracking is not a nice-to-have. It is a foundational capability for any organization shipping AI to users . The cost is modest—a tracking server, logging code, and integrated pipelines. The return is immediate.
The first time you have to compare 50 hyperparameter runs side-by-side to find the winning configuration, you will never go back. The first time a teammate picks up your experiment and reproduces it in minutes instead of days, you’ll see how experiment tracking unlocks team productivity.
Three Steps to Get Started
- Choose a tracking tool appropriate for your scale. MLflow for open source, W&B or Comet for managed collaboration .
- Log every experiment from day one. Even failed runs provide value. Adopt structured naming and comprehensive logging .
- Integrate with model registry and CI/CD. Connect experiment tracking to model versioning and production deployment for full lifecycle management .
The teams that do this ship better AI products faster. The teams that don’t spend their weekends debugging notebook graveyards. The choice is clear.
This article draws on production experience from teams deploying ML applications at enterprise scale, with insights from MLflow, Comet, AWS, Databricks, and leading experiment tracking platforms .

Leave a Reply