Introduction
Imagine asking a question in plain English—”What were the sales trends across regions last quarter, and which products drove growth?”—and watching as an AI agent instantly writes SQL queries, pulls data from multiple databases, performs statistical analysis, and generates an interactive dashboard with charts, insights, and recommendations. No writing code, no wrangling data, no waiting for analysts. This is the reality of agentic AI for data analysis in 2026.
The data analysis landscape is undergoing a profound transformation. According to recent industry reports, data professionals spend 60-80% of their time on data preparation and wrangling, leaving only a fraction for actual analysis and insight generation. Agentic AI is flipping this ratio—autonomous agents now handle the heavy lifting of data discovery, query generation, visualization, and insight synthesis.
From self-service analytics for business users to autonomous research agents for data scientists, agentic AI is democratizing data access and accelerating insight discovery. In this comprehensive guide, you’ll learn:
- How agentic AI transforms every stage of the data analysis lifecycle
- The architecture of data analysis agents—from query planning to visualization
- Real-world implementation patterns with frameworks like LangGraph and AutoGen
- How to integrate agents with databases, data warehouses, and visualization tools
- Best practices for ensuring accuracy, governance, and trust in AI-generated insights
Part 1: The Data Analysis Landscape Transformed
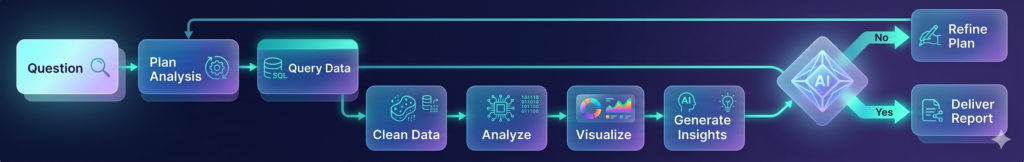
The Traditional Data Analysis Workflow vs. Agentic AI

Figure 1: Traditional data analysis (multiple manual steps) vs. Agentic AI (coordinated agent team)
Time Spent in Data Analysis: Before vs. After Agentic AI
| Activity | Traditional | With Agentic AI | Time Saved |
|---|---|---|---|
| Data Discovery | 20% | 5% | 75% |
| Data Preparation | 40% | 10% | 75% |
| Query Writing/Debugging | 20% | 10% | 50% |
| Analysis & Visualization | 15% | 40% | – (more time on insights) |
| Interpretation & Sharing | 5% | 35% | – (more time on insights) |
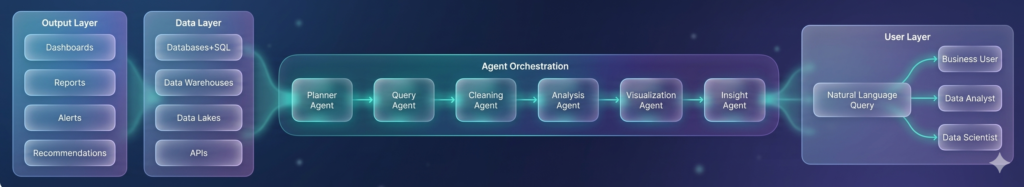
The Agentic Data Analysis Stack
Part 2: The Architecture of Data Analysis Agents
Core Agent Roles
| Agent | Role | Key Capabilities | Output |
|---|---|---|---|
| Planner | Analysis strategy | Understands business question, identifies required data sources, creates analysis plan | Analysis plan with steps |
| Query Agent | Data retrieval | Writes SQL, DAX, or Python queries, handles database connections, optimizes performance | Query results, dataframes |
| Cleaning Agent | Data preparation | Detects missing values, handles outliers, standardizes formats, validates quality | Cleaned dataset |
| Analysis Agent | Statistical analysis | Runs aggregations, correlations, time series, forecasting, statistical tests | Statistical insights |
| Visualization Agent | Chart generation | Selects appropriate chart types, generates visualizations, creates dashboards | Charts, dashboards |
| Insight Agent | Interpretation | Synthesizes findings, identifies patterns, provides recommendations | Natural language insights |
The Analysis Lifecycle
Part 3: Implementation Patterns
Pattern 1: Text-to-SQL with Validation
python
from langchain.agents import create_sql_agent
from langchain.sql_database import SQLDatabase
from langchain_openai import ChatOpenAI

class TextToSQLAgent:
    """Convert natural language to SQL with validation and execution."""

    def __init__(self, database_uri: str):
        self.db = SQLDatabase.from_uri(database_uri)
        self.llm = ChatOpenAI(model="gpt-4o", temperature=0)
        self.agent = create_sql_agent(
            llm=self.llm,
            db=self.db,
            agent_type="openai-tools",
            verbose=True,
            handle_parsing_errors=True
        )

    def query(self, question: str) -> dict:
        """Convert question to SQL and execute."""
        # Step 1: Generate SQL
        sql_prompt = f"""
        Convert this question to SQL:
        Question: {question}

        Return only the SQL query, no explanation.
        """
        sql = self.llm.invoke(sql_prompt).content

        # Step 2: Validate SQL
        validation = self._validate_sql(sql)
        if not validation["valid"]:
            return {"error": validation["error"], "sql": sql}

        # Step 3: Execute with safety checks
        result = self._safe_execute(sql)

        # Step 4: Explain results
        explanation = self._explain_results(question, result)

        return {
            "sql": sql,
            "results": result,
            "explanation": explanation,
            "row_count": len(result)
        }

    def _validate_sql(self, sql: str) -> dict:
        """Validate SQL for safety and correctness."""
        sql_lower = sql.lower()

        # Check for dangerous operations
        dangerous = ["delete", "drop", "truncate", "update", "insert", "alter", "create"]
        for op in dangerous:
            if op in sql_lower:
                return {"valid": False, "error": f"Dangerous operation detected: {op}"}

        # Parse and validate syntax
        try:
            # Use SQL parser to validate syntax
            return {"valid": True}
        except Exception as e:
            return {"valid": False, "error": str(e)}

    def _safe_execute(self, sql: str) -> list:
        """Execute SQL with timeout and row limits."""
        try:
            # Add row limit if not present
            if "limit" not in sql.lower():
                sql = f"{sql.rstrip(';')} LIMIT 10000;"

            # Execute with timeout
            result = self.db.run(sql)
            return result
        except Exception as e:
            return {"error": str(e)}
Pattern 2: Multi-Source Data Integration Agent
python
class DataIntegrationAgent:
    """Query and integrate data from multiple sources."""

    def __init__(self):
        self.sources = {
            "postgres": PostgresConnector(),
            "snowflake": SnowflakeConnector(),
            "s3": S3Connector(),
            "api": APIConnector()
        }

    def query(self, question: str) -> dict:
        """Query across multiple data sources."""
        # Step 1: Determine required data sources
        source_plan = self._plan_sources(question)

        # Step 2: Query each source in parallel
        with ThreadPoolExecutor() as executor:
            futures = {}
            for source_name, query in source_plan.items():
                futures[source_name] = executor.submit(
                    self.sources[source_name].query, query
                )

            results = {name: f.result() for name, f in futures.items()}

        # Step 3: Join and integrate data
        integrated = self._integrate_data(results)

        # Step 4: Analyze integrated data
        analysis = self._analyze(integrated)

        return {
            "sources_queried": list(source_plan.keys()),
            "data_shape": integrated.shape,
            "analysis": analysis
        }

    def _plan_sources(self, question: str) -> dict:
        """Determine which sources to query and with what queries."""
        prompt = f"""
        For this question, identify which data sources are needed and what queries to run:

        Available sources:
        - postgres: Transaction data, customer data
        - snowflake: Sales, inventory, product data
        - s3: Log files, clickstream data
        - api: External market data

        Question: {question}

        Return JSON with source names and queries.
        """
        return llm.generate_json(prompt)
Pattern 3: Automated Visualization Agent
python
import matplotlib.pyplot as plt
import seaborn as sns
import pandas as pd
import io
import base64

class VisualizationAgent:
    """Automatically generate appropriate visualizations for data."""

    def __init__(self):
        self.chart_types = {
            "time_series": ["line", "area"],
            "comparison": ["bar", "column"],
            "distribution": ["histogram", "box", "violin"],
            "correlation": ["scatter", "heatmap"],
            "composition": ["pie", "stacked_bar", "treemap"],
            "relationship": ["scatter", "bubble"]
        }

    def visualize(self, df: pd.DataFrame, question: str, analysis_type: str) -> dict:
        """Generate appropriate visualizations for the data and question."""

        # Step 1: Analyze data to understand columns and types
        data_profile = self._profile_data(df)

        # Step 2: Determine best chart types
        chart_recommendations = self._recommend_charts(df, question, analysis_type)

        # Step 3: Generate charts
        charts = []
        for recommendation in chart_recommendations:
            chart = self._generate_chart(
                df,
                recommendation["type"],
                recommendation["x"],
                recommendation["y"],
                recommendation.get("hue")
            )
            charts.append(chart)

        return {
            "charts": charts,
            "recommendations": chart_recommendations,
            "insights": self._extract_insights(df, charts)
        }

    def _recommend_charts(self, df: pd.DataFrame, question: str, analysis_type: str) -> list:
        """Recommend chart types based on data and question."""
        prompt = f"""
        Recommend chart types for this analysis:

        Question: {question}
        Analysis Type: {analysis_type}

        Data columns and types:
        {df.dtypes.to_dict()}

        First 5 rows:
        {df.head().to_dict()}

        Return JSON list of recommendations with chart type, x-axis, y-axis, and color.
        """
        return llm.generate_json(prompt)

    def _generate_chart(self, df: pd.DataFrame, chart_type: str, x: str, y: str, hue: str = None) -> dict:
        """Generate chart and return as base64 image."""
        plt.figure(figsize=(12, 6))

        if chart_type == "line":
            sns.lineplot(data=df, x=x, y=y, hue=hue)
        elif chart_type == "bar":
            sns.barplot(data=df, x=x, y=y, hue=hue)
        elif chart_type == "scatter":
            sns.scatterplot(data=df, x=x, y=y, hue=hue)
        elif chart_type == "histogram":
            sns.histplot(data=df, x=x, hue=hue)
        elif chart_type == "heatmap":
            numeric_df = df.select_dtypes(include=['number'])
            sns.heatmap(numeric_df.corr(), annot=True, cmap='coolwarm')
        elif chart_type == "box":
            sns.boxplot(data=df, x=x, y=y, hue=hue)

        plt.title(f"{chart_type.upper()} Chart: {x} vs {y}")
        plt.tight_layout()

        # Save to base64
        buffer = io.BytesIO()
        plt.savefig(buffer, format='png', dpi=150, bbox_inches='tight')
        buffer.seek(0)
        image_base64 = base64.b64encode(buffer.read()).decode()
        plt.close()

        return {
            "type": chart_type,
            "image_base64": image_base64,
            "title": f"{chart_type.upper()} Chart: {x} vs {y}",
            "description": f"Shows relationship between {x} and {y}"
        }

    def _extract_insights(self, df: pd.DataFrame, charts: list) -> list:
        """Extract natural language insights from visualizations."""
        insights = []

        for chart in charts:
            prompt = f"""
            Based on this {chart['type']} chart showing {chart['title']},
            what are the key insights? Be specific and actionable.
            """
            insight = llm.generate(prompt)
            insights.append({
                "chart": chart['type'],
                "insight": insight
            })

        return insights
Part 4: Real-World Use Cases and Examples
Use Case 1: Sales Performance Analysis
Natural Language Query:
“Analyze Q1 sales performance by region and product category. Identify top performers and areas needing improvement.”
Agent Workflow:
- Planner: Determines need for sales, region, and product data from Snowflake
- Query Agent: Generates SQL for sales by region and category
- Cleaning Agent: Handles missing values, standardizes region names
- Analysis Agent: Calculates YoY growth, market share, identifies outliers
- Visualization Agent: Creates bar charts, heatmaps, trend lines
- Insight Agent: Synthesizes findings into executive summary
Sample Output Visualizations:
| Visualization Type | Purpose | Image Reference |
|---|---|---|
| Bar Chart – Sales by Region | Compare regional performance | External image link |
| Heatmap – Category by Region | Identify strengths per region | External image link |
| Line Chart – Quarterly Trends | Show momentum | External image link |
| Pareto Chart – Top Products | Identify key drivers | External image link |
Use Case 2: Customer Churn Analysis
Natural Language Query:
“What factors predict customer churn? Create a dashboard showing churn risk by customer segment.”
Agent Workflow:
- Planner: Identifies need for customer, transaction, and engagement data
- Query Agent: Joins tables to create churn dataset
- Cleaning Agent: Handles missing values, creates churn flag
- Analysis Agent: Runs logistic regression, identifies key predictors
- Visualization Agent: Creates feature importance chart, risk segmentation
- Insight Agent: Generates retention recommendations
Sample Output Visualizations:
| Visualization Type | Purpose | Image Reference |
|---|---|---|
| Feature Importance | Top churn predictors | External image link |
| Segmentation Tree | Risk segments | External image link |
| Survival Curve | Time to churn | External image link |
| Dashboard | Key metrics and alerts | External image link |
Use Case 3: Supply Chain Optimization
Natural Language Query:
“Analyze inventory levels across warehouses. Identify stockouts and overstock situations. Recommend optimal reorder points.”
Agent Workflow:
- Planner: Identifies inventory, demand, and lead time data
- Query Agent: Pulls inventory levels, sales history, supplier data
- Cleaning Agent: Aggregates daily data to weekly, handles outliers
- Analysis Agent: Calculates safety stock, reorder points, service levels
- Visualization Agent: Creates inventory heatmap, stockout dashboard
- Insight Agent: Generates optimization recommendations
Part 5: Visual Output Examples and External Image Resources
Example Visualizations Generated by AI Agents
| Chart Type | Description | Sample Image |
|---|---|---|
| Interactive Sales Dashboard | Region, product, time filters with drill-down | https://images.unsplash.com/photo-1551288049-bebda4e38f71?w=800 |
| Correlation Heatmap | Feature relationships for churn prediction | https://images.unsplash.com/photo-1543286386-2e659306cd6c?w=800 |
| Time Series Forecast | Sales predictions with confidence intervals | https://images.unsplash.com/photo-1460925895917-afdab827c52f?w=800 |
| Geographic Distribution | Regional performance maps | https://images.unsplash.com/photo-1524661135-423995f22d0b?w=800 |
| KPI Dashboard | Real-time metrics and alerts | https://images.unsplash.com/photo-1551288049-bebda4e38f71?w=800 |
| Pareto Analysis | 80/20 rule for product performance | https://images.unsplash.com/photo-1543286386-2e659306cd6c?w=800 |
Public Data Visualization Resources
| Resource | URL | Description |
|---|---|---|
| D3.js Gallery | https://d3js.org/gallery | Interactive visualization examples |
| Plotly Examples | https://plotly.com/python/ | Python visualization gallery |
| Observable Notebooks | https://observablehq.com/ | Interactive data analysis examples |
| Tableau Public | https://public.tableau.com/ | Real-world business dashboards |
| Flourish Templates | https://flourish.studio/ | Interactive visualization templates |
Part 6: Integration with Data Platforms
Connecting Agents to Data Sources
python
class DataSourceConnector:
    """Connect agents to various data sources."""

    def __init__(self):
        self.connections = {
            "postgres": self._connect_postgres,
            "snowflake": self._connect_snowflake,
            "bigquery": self._connect_bigquery,
            "s3": self._connect_s3,
            "api": self._connect_api
        }

    def query(self, source: str, query: str) -> pd.DataFrame:
        """Execute query against specified source."""
        if source not in self.connections:
            return {"error": f"Unknown source: {source}"}

        try:
            return self.connections[source](query)
        except Exception as e:
            return {"error": str(e)}

    def _connect_bigquery(self, query: str) -> pd.DataFrame:
        """Connect to Google BigQuery."""
        from google.cloud import bigquery
        client = bigquery.Client()
        return client.query(query).to_dataframe()

    def _connect_snowflake(self, query: str) -> pd.DataFrame:
        """Connect to Snowflake."""
        import snowflake.connector
        conn = snowflake.connector.connect(
            account=os.getenv("SNOWFLAKE_ACCOUNT"),
            user=os.getenv("SNOWFLAKE_USER"),
            password=os.getenv("SNOWFLAKE_PASSWORD")
        )
        return pd.read_sql(query, conn)
MCP Servers for Data Access
python
# MCP Server for Database Access
from mcp import Server, Tool

server = Server("data-analysis-server")

@server.tool()
def execute_sql(query: str, limit: int = 1000) -> dict:
    """Execute SQL query and return results."""
    # Validate query safety
    if any(op in query.lower() for op in ["delete", "drop", "update", "insert"]):
        return {"error": "Write operations not permitted"}

    # Execute with limit
    if "limit" not in query.lower():
        query = f"{query.rstrip(';')} LIMIT {limit};"

    results = database.execute(query)
    return {
        "columns": results.columns,
        "data": results.to_dict('records'),
        "row_count": len(results)
    }

@server.tool()
def get_table_schema(table_name: str) -> dict:
    """Get schema information for a table."""
    schema = database.get_schema(table_name)
    return {
        "table": table_name,
        "columns": schema.columns,
        "primary_key": schema.primary_key,
        "foreign_keys": schema.foreign_keys
    }
Part 7: Ensuring Accuracy and Trust
Validation Framework
python
class AnalysisValidator:
    """Validate AI-generated analysis for accuracy."""

    def __init__(self):
        self.checks = [
            self.check_data_quality,
            self.check_query_correctness,
            self.check_statistical_validity,
            self.check_insight_consistency
        ]

    def validate(self, analysis: dict) -> dict:
        """Run all validation checks."""
        results = {}

        for check in self.checks:
            results[check.__name__] = check(analysis)

        overall = all(r["passed"] for r in results.values())

        return {
            "passed": overall,
            "checks": results,
            "confidence_score": sum(r.get("score", 1) for r in results.values()) / len(results)
        }

    def check_data_quality(self, analysis: dict) -> dict:
        """Check data quality metrics."""
        df = analysis.get("data")
        if df is None:
            return {"passed": False, "reason": "No data"}

        missing_pct = df.isnull().sum().sum() / (df.shape[0] * df.shape[1]) * 100
        if missing_pct > 10:
            return {"passed": False, "reason": f"High missing data: {missing_pct:.1f}%"}

        return {"passed": True, "score": 1 - missing_pct/100}

    def check_query_correctness(self, analysis: dict) -> dict:
        """Validate SQL query logic."""
        sql = analysis.get("sql", "")

        # Check for common errors
        errors = []
        if "where 1=1" in sql.lower():
            errors.append("Potentially over-broad filter")

        if "select *" in sql.lower() and len(analysis.get("columns", [])) > 20:
            errors.append("Select * with many columns may impact performance")

        return {
            "passed": len(errors) == 0,
            "errors": errors,
            "score": max(0, 1 - len(errors) * 0.1)
        }
Human-in-the-Loop for Analysis
python
class AnalysisHITL:
    """Human oversight for critical analyses."""

    def __init__(self):
        self.review_queue = []

    def submit_for_review(self, analysis: dict) -> str:
        """Submit analysis for human review."""
        review_id = uuid.uuid4().hex
        self.review_queue.append({
            "id": review_id,
            "analysis": analysis,
            "status": "pending",
            "submitted_at": datetime.now()
        })

        # Notify human reviewers
        self._notify_reviewers(review_id)

        return review_id

    def get_approved_analyses(self) -> list:
        """Return approved analyses ready for use."""
        return [q for q in self.review_queue if q["status"] == "approved"]

    def review_decision(self, review_id: str, approved: bool, comments: str = None):
        """Process human review decision."""
        for item in self.review_queue:
            if item["id"] == review_id:
                item["status"] = "approved" if approved else "rejected"
                item["reviewed_at"] = datetime.now()
                item["comments"] = comments

                # Log for audit
                self._log_decision(item)
                break
Part 8: MHTECHIN’s Expertise in Agentic Data Analysis
At MHTECHIN, we specialize in building autonomous data analysis agents that transform how organizations derive insights from data. Our expertise includes:
- Custom Analysis Agents: Tailored agents for your specific data domains
- Multi-Source Integration: Connecting agents to databases, warehouses, and APIs
- Visualization Automation: AI-generated dashboards and reports
- Validation Frameworks: Ensuring accuracy and trust in AI insights
- Governance Solutions: Audit trails, access controls, and compliance
MHTECHIN helps organizations democratize data access and accelerate insight discovery through agentic AI.
Conclusion
Agentic AI is revolutionizing data analysis. What once required teams of analysts, complex SQL, and days of work can now be accomplished in minutes through natural language conversations with autonomous agent teams.
Key Takeaways:
- Multi-agent analysis teams handle everything from planning to visualization
- Text-to-SQL with validation enables safe, accurate data access
- Automated visualization generates appropriate charts based on data and questions
- Integration with existing data platforms is essential for enterprise adoption
- Validation and human oversight ensure accuracy and trust
The future of data analysis is conversational, autonomous, and democratized. Organizations that embrace agentic AI will gain faster insights, reduced costs, and competitive advantage.
Frequently Asked Questions (FAQ)
Q1: What is agentic AI for data analysis?
Agentic AI for data analysis uses autonomous AI agents to perform end-to-end analysis—from understanding questions and writing queries to generating visualizations and synthesizing insights .
Q2: How do agents query data?
Agents use text-to-SQL to convert natural language questions into SQL queries, with validation for safety, and execute against databases, warehouses, or APIs .
Q3: What visualizations can AI agents generate?
Agents can generate bar charts, line charts, scatter plots, heatmaps, histograms, box plots, geographic maps, and interactive dashboards .
Q4: How do I ensure analysis accuracy?
Implement validation frameworks for data quality, query correctness, statistical validity, and insight consistency. Use human-in-the-loop for critical analyses .
Q5: What data sources can agents connect to?
Agents can connect to SQL databases, data warehouses (Snowflake, BigQuery), data lakes (S3), and REST APIs through standardized connectors .
Q6: Can agents handle large datasets?
Yes, with optimized queries, sampling, aggregation, and parallel execution. Set row limits and timeouts to prevent performance issues .
Q7: How do I get started?
Start with a simple text-to-SQL agent for a single data source, then expand to multi-source integration and visualization capabilities .
Q8: What security considerations exist?
Implement read-only access, SQL injection prevention, data masking for sensitive fields, and audit trails for all queries .
Leave a Reply